Lifting
Solutions
Smarter Safely
Specialist crane and lifting safety training built on three decades on the floor — turning compliance into a culture people actually carry home.
Safety that holds under load
LSSS is the training practice of Tamer Hashem — HSSE governance and crane safety specialist with the EMSTEEL Group.
Cranes don't forgive guesswork. Every programme here starts from real incident data and the mechanics of the lift, not a slide deck. The goal is simple: operators, riggers and supervisors who can read a hazard before it becomes a headline.
Over a 30-year career across heavy industry, the LSSS method has been refined, independently tested and recognised by the Global Steel Association — with evaluated programmes reaching a 95% measured outcome rate among participants.
It is delivered in plain language, on site, in the conditions crews actually work in. That is what makes it stick.
Three decades under load
A professional track record built on the floor of heavy industry — from hands-on lifting operations to governance, authorship and recognised training.
Trainer · Crane Safety & HSSE Governance
Leads crane and lifting safety training, compliance frameworks, audit readiness and field assurance across industrial-scale lifting environments.
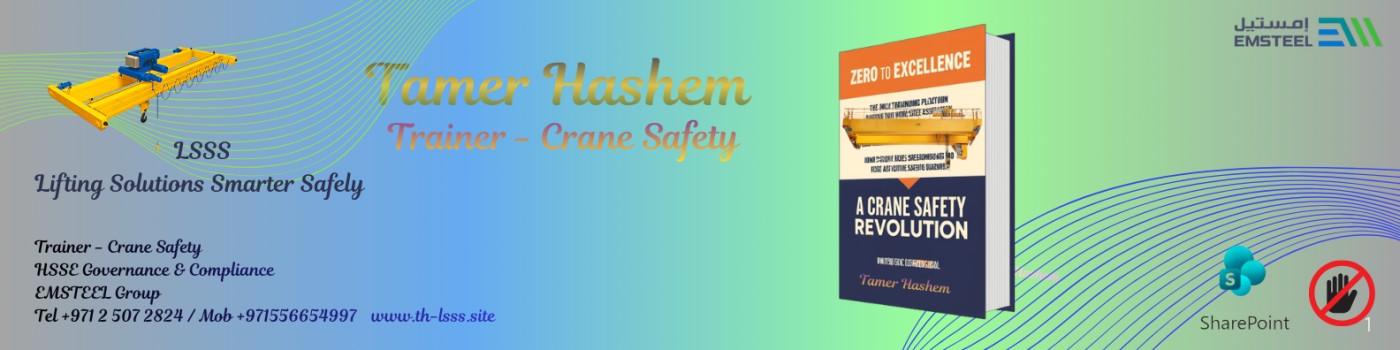
Author — Zero to Excellence: A Crane Safety Revolution
Codified three decades of incident-led practice into a step-change model that takes teams from baseline compliance to a measurable safety culture.
Award-Winning, Independently Tested Programme
The LSSS method was independently evaluated and recognised, reaching a 95% measured outcome rate among participants.
Lifting Operations Across Heavy Industry
A long career on the floor — overhead and mobile crane operation, rigging, lift planning and supervision — the foundation every programme is built on.
Safety Revolution
Zero to Excellence: A Crane Safety Revolution
The written companion to the LSSS programme — a practical field guide that takes a team from baseline compliance to a genuine safety culture, one verified habit at a time.
- Incident-led lessons drawn from three decades of real lifts
- A step-change model for moving crews from "zero" to "excellence"
- Tools for supervisors to embed and measure positive safety behaviour
Training programmes
Modular sessions for operators, riggers, supervisors and HSSE leads — scaled to your site and your risk profile.
Overhead Crane Operation
Safe operating envelopes, load charts, signalling discipline and pre-use inspection for overhead and gantry cranes.
Rigging & Slinging
Sling selection, angles, centre of gravity and tag-line control.
Lift Planning
Method statements, exclusion zones and critical-lift sign-off.
HSSE Governance
Audit readiness, compliance frameworks and incident review.
Supervisor & Train-the-Trainer
Build in-house capability so safe behaviour outlives any single course — the core of the Zero to Excellence model.
Book a session
Tell us your site, crew size and risk profile and a tailored programme outline will follow.
Lifting Solutions
Smarter Safely
Crane & lifting safety training, governance and culture — led by Tamer Hashem, EMSTEEL Group.